Key Statistics
- Film industry in the U.S. is currently worth at $25.8 billion.
- Box office market has reached $5.9 billion in 2022, up 32% from 2021
- Movie theaters across the U.S. and Canada sold approximately 844 million tickets so far in 2022
- The average person sees approximately 6 movies in a theater each year.
- China has the largest movie industry in the world, followed by the U.S. and Japan.
- In 2021, the number of moviegoers (people who go to the cinema at least once a year) and tickets sold was higher for men (53) than women (47%).
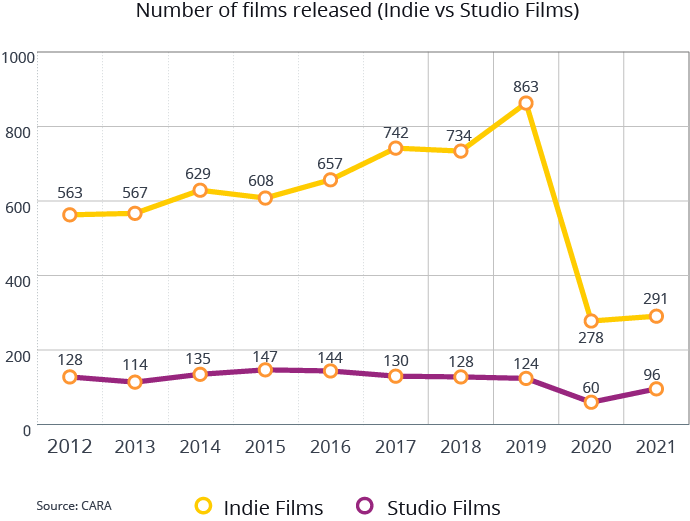
How many independent movies are produced each year?
There is no concrete answer as to how many independent films are produced each year. Thanks to advancements in technology – including more accessible filming and editing equipment, as well as digital platforms that make it easy to sell movies – it’s now possible for anyone to produce and distribute their own independent film. One way we can define the number of independent films released in a specific year is by examining all titles that opened and earned any studio-reported U.S./ Canada box office.
Using data from CARA, we can examine these numbers from two groups – films by one of the six major Hollywood studios (i.e. Warners, Disney, Fox, Paramount, Sony and Universal) versus all other non-studio films. This shows that non-studio films released the most films domestically in 2021 (291) compared to major studios (96).
of independent films do not get any theatrical release
This shows that, although independent movies are being produced in much larger numbers, a big chunk of them go unseen.
of independent films are able to recoup their investment
Out of those indie films that did make it to cinemas, the majority didn’t generate enough revenue to cover the costs of making, marketing, and distributing the movie.
of indie films recoup their investment during their first year
An independent film takes time to get recognized and to gain worldwide income.
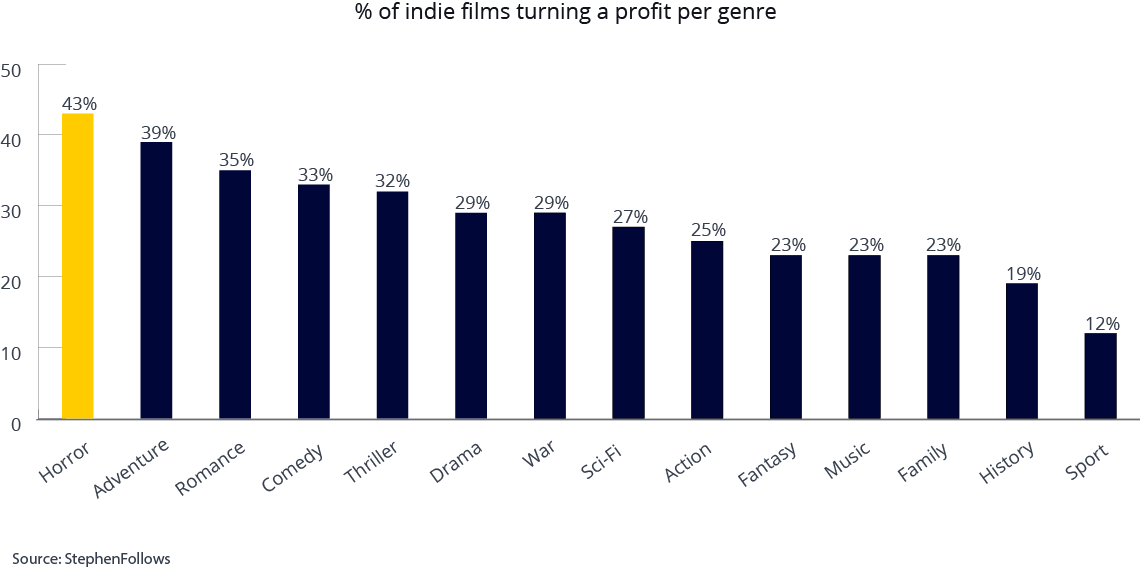
What genres of independent films are most profitable?
When it comes to independent films that are most likely to be successful, horror movies are by far the most likely to turn a profit. The genres that have the poorest chances of success are sports movies and historical films, with recoupment rates of around 12% and 19%, respectively. Although the stories of sports stars like Senna and Diego Maradona are fascinating, they don’t resonate with audiences in the same way that big studio-produced films do.
THEATRICAL FILM STATISTICS
FILM INDUSTRY IS WORTH AT $25.8BN
The market size of the film industry in the US has declined 4.8% per year on average between 2017 and 2022.
THERE ARE 5,798 CINEMA SITES
There has been a significant decrease in the number of cinema sites in the U.S., dropping from 7,744 in 1995 to just over 6,100 in 2005.
2.2 MILLION PEOPLE EMPLOYED
The film industry supports 2.2 million jobs, pays out $192 billion in total wages, and comprises over 110,000 businesses.
BOX OFFICE REVENUE REACHED $5.96BN
Box office market has reached $5.9 billion in 2022, up 32% from 2021, although still down substantially compared to the $11bn in 2019
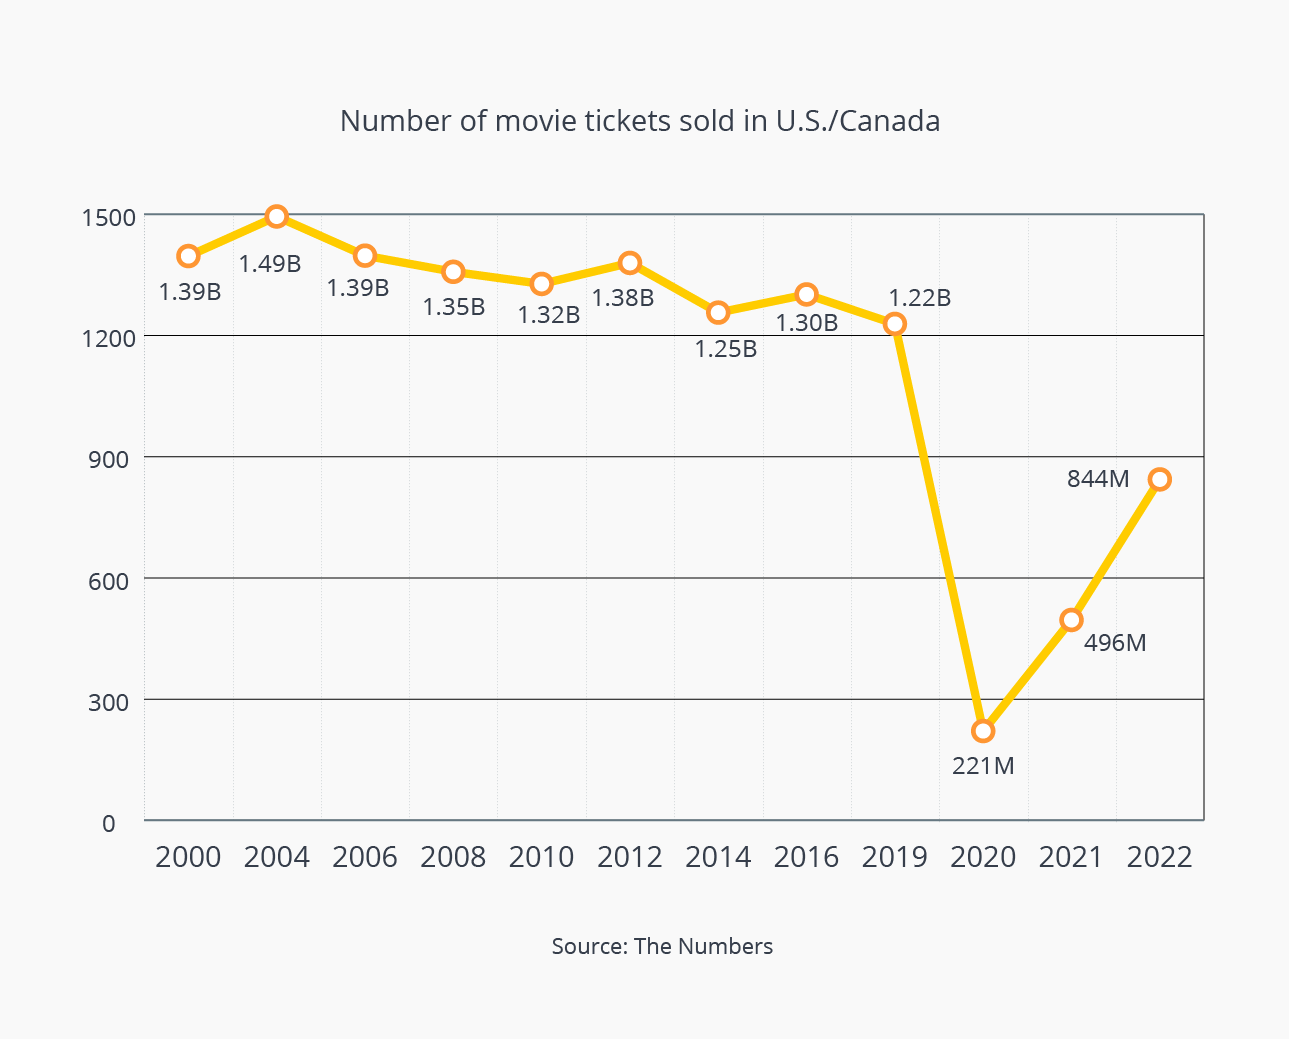
Box office sales are rebounding from COVID
As we settle into a new normal, it’s clear that audiences are no longer content to just sit on the couch and watch movies. In 2022, movie theaters across the U.S. and Canada sold approximately 844 million tickets so far – an annual increase of about 281% from two years before.
Although this figure is impressive, it still pales in comparison to the nearly 1.22 billion movie tickets sold in 2019 – before the COVID-19 outbreak forced many theaters to close their doors.
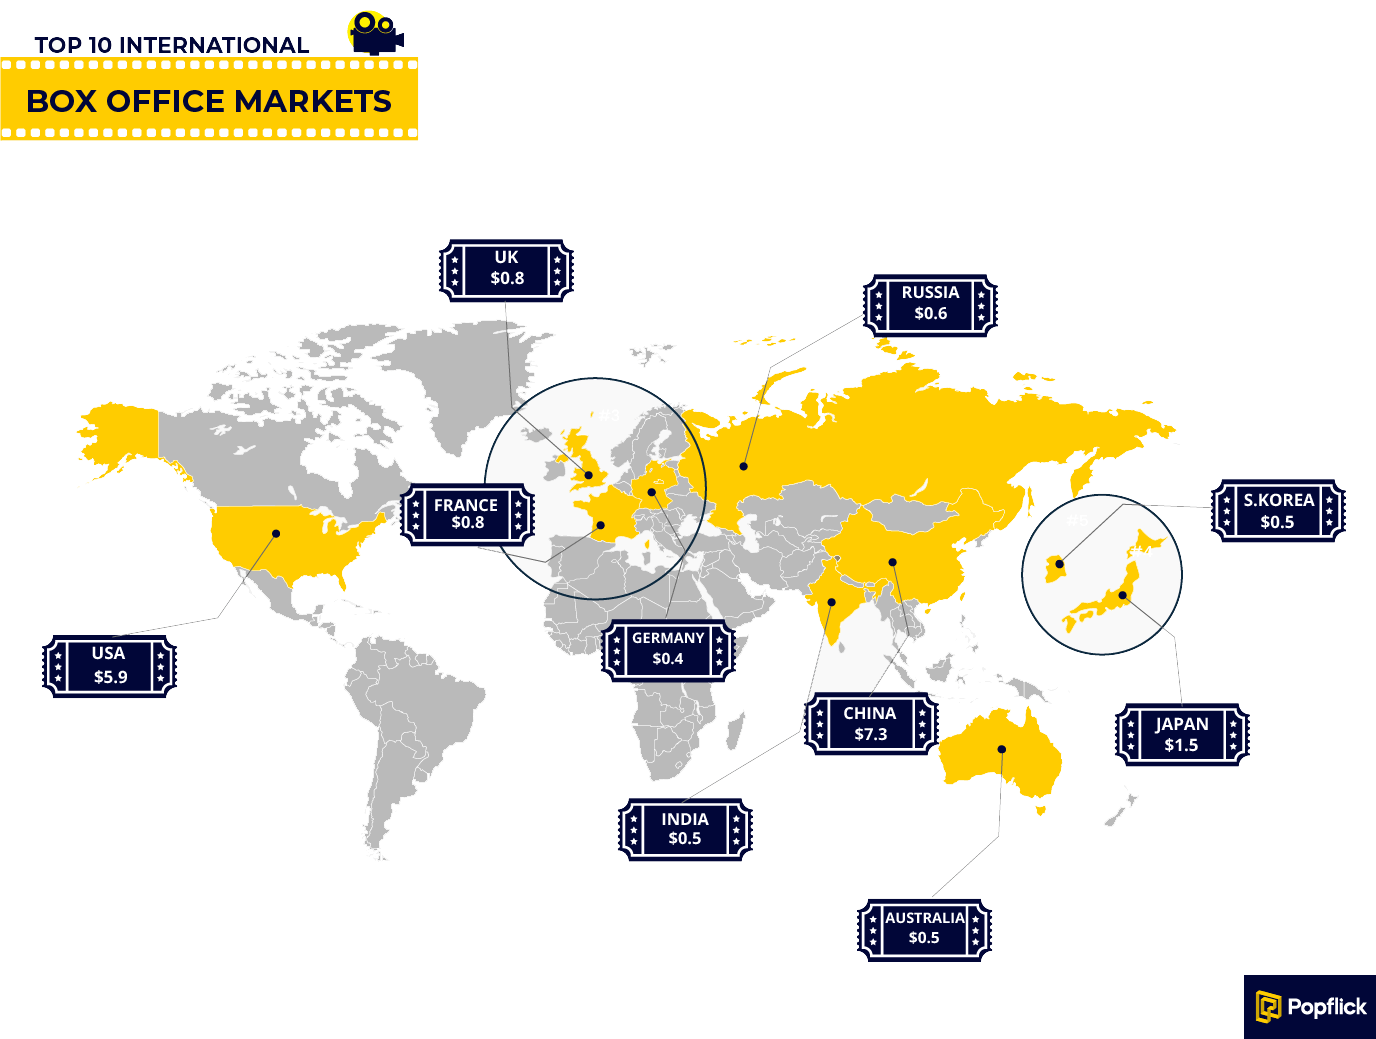
Top box office markets worldwide
China has the highest box office revenue worldwide at $7.3 billion which is more than the revenues of the U.S., Japan and the U.K. combined. France ranks fourth alongside the U.K., each grossing around $800 million. It’s also interesting to note that China’s box office surpassed that of the U.S. for the second time in a row, with most Chinese theaters staying open throughout 2021.
Movie going demographics
In 2021, only 47% of the population in the U.S./Canada went to the cinema at least once. Out of that group, only 12 million people (3% of the population) were considered frequent moviegoers – people who go to the cinema once a month or more. That means that more than half of the population in North America did not attend the cinema at all last year!

Non-moviegoers
This includes people who did not attend the cinema at all.

Occasional movie goers
This includes people who attended the cinema les than once a month.

Infrequent moviegoers
It includes people who attended the cinema once a year.

Frequent moviegoers
This includes people who go to the cinema oncrea month or more.
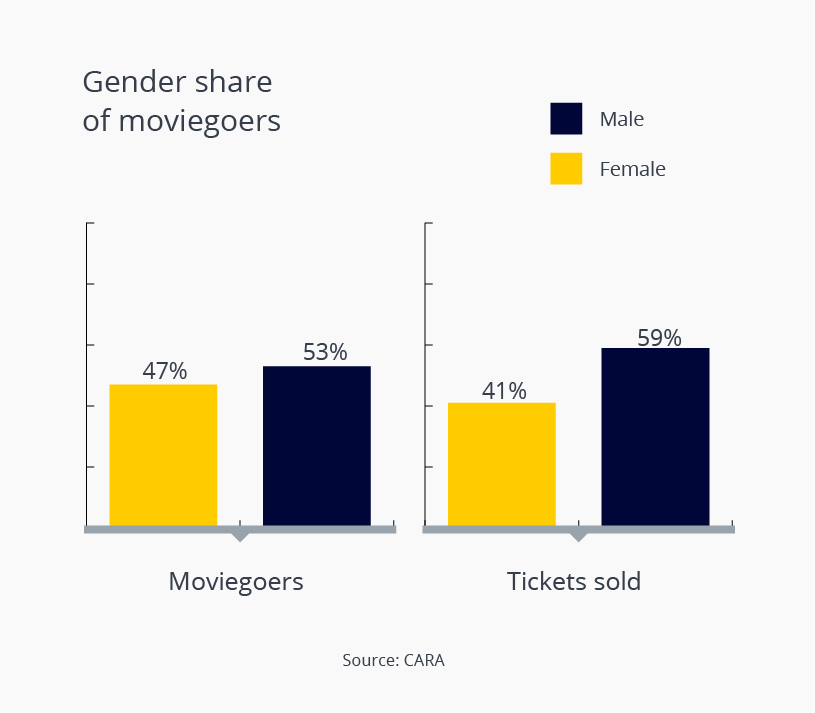
Men go to the cinemas more often than women
When analyzing overall attendance, it’s evident that more men than women go to the movies. In 2021, the number of moviegoers (people who go to the cinema at least once a year) and tickets sold was higher for men than women relative to their proportion of the population.
This is a stark contrast to 2009, when the moviegoing audience in the U.S./Canada was 52% female and 48% male – which is pretty much reflective of the breakdown among the U.S. population as a whole.
GLOBAL HOME/MOBILE ENTERTAINMENT REACHED $78.5BN
This is a a 14% increase compared to 2020. The digital market increased 11% in the U.S. and 24% outside the U.S., compared to 2020.
SUBSCRIPTIONS TO ONLINE VIDEOS INCREASED TO $1.3BN
Online video subscriptions have surpassed satellite TV in terms of subscription revenue, making it the second largest subscription market in 2021.
80% OF PEOPLE WATCH MOVIES ON TV
Of all the ways that American adults watch movies and TV, the highest proportion do so via traditional television services and online subscription services.
180 ORIGINAL FILMS WERE RELEASED ONLINE IN 2021
In 2021, nearly 180 original films were released exclusively online, comparable to 2020 and an increase of over 90% from 2017.
Home and mobile entertainment market in the U.S.
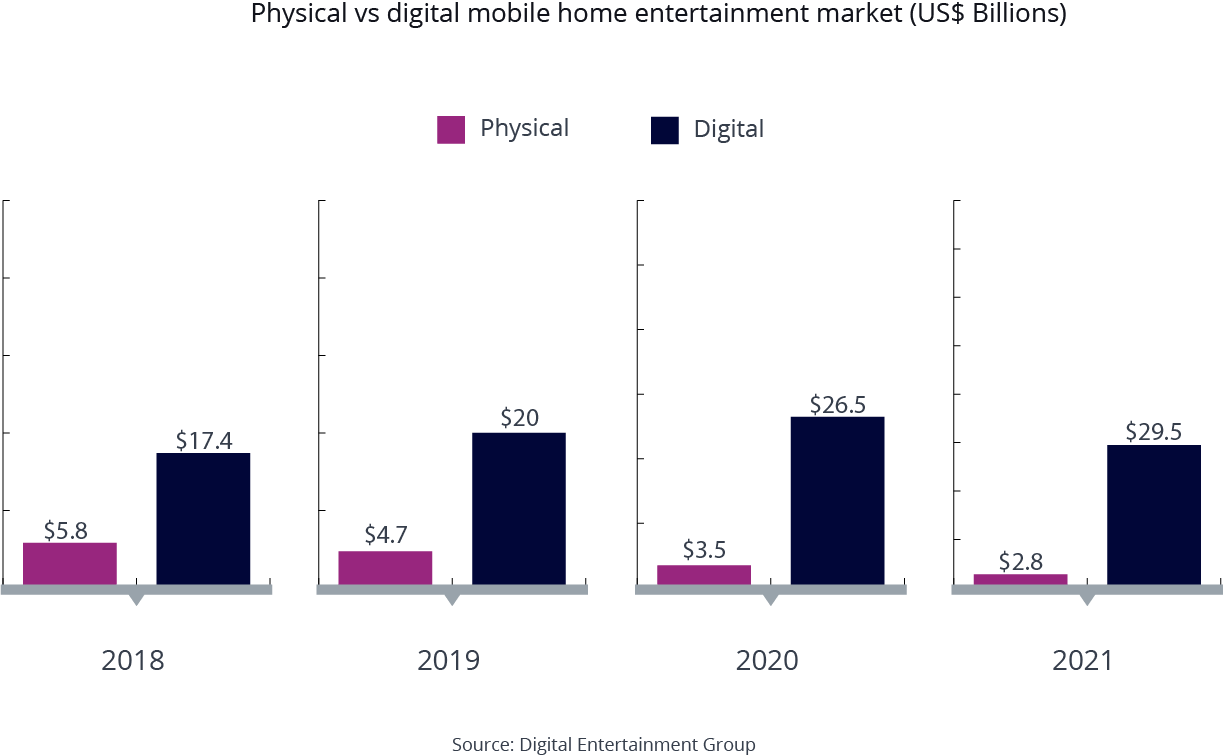
The home/mobile entertainment market in the United States was $32.3 billion in 2021, up 7% percent compared to 2020. The digital market increased by 11% compared to 2020, while the physical market decreased by 20%. Physical includes sell-through packaged goods and physical rental. Digital includes EST, VOD, and subscription streaming (SVOD).VOD spending does not include premium Video-on-Demand (PVOD).
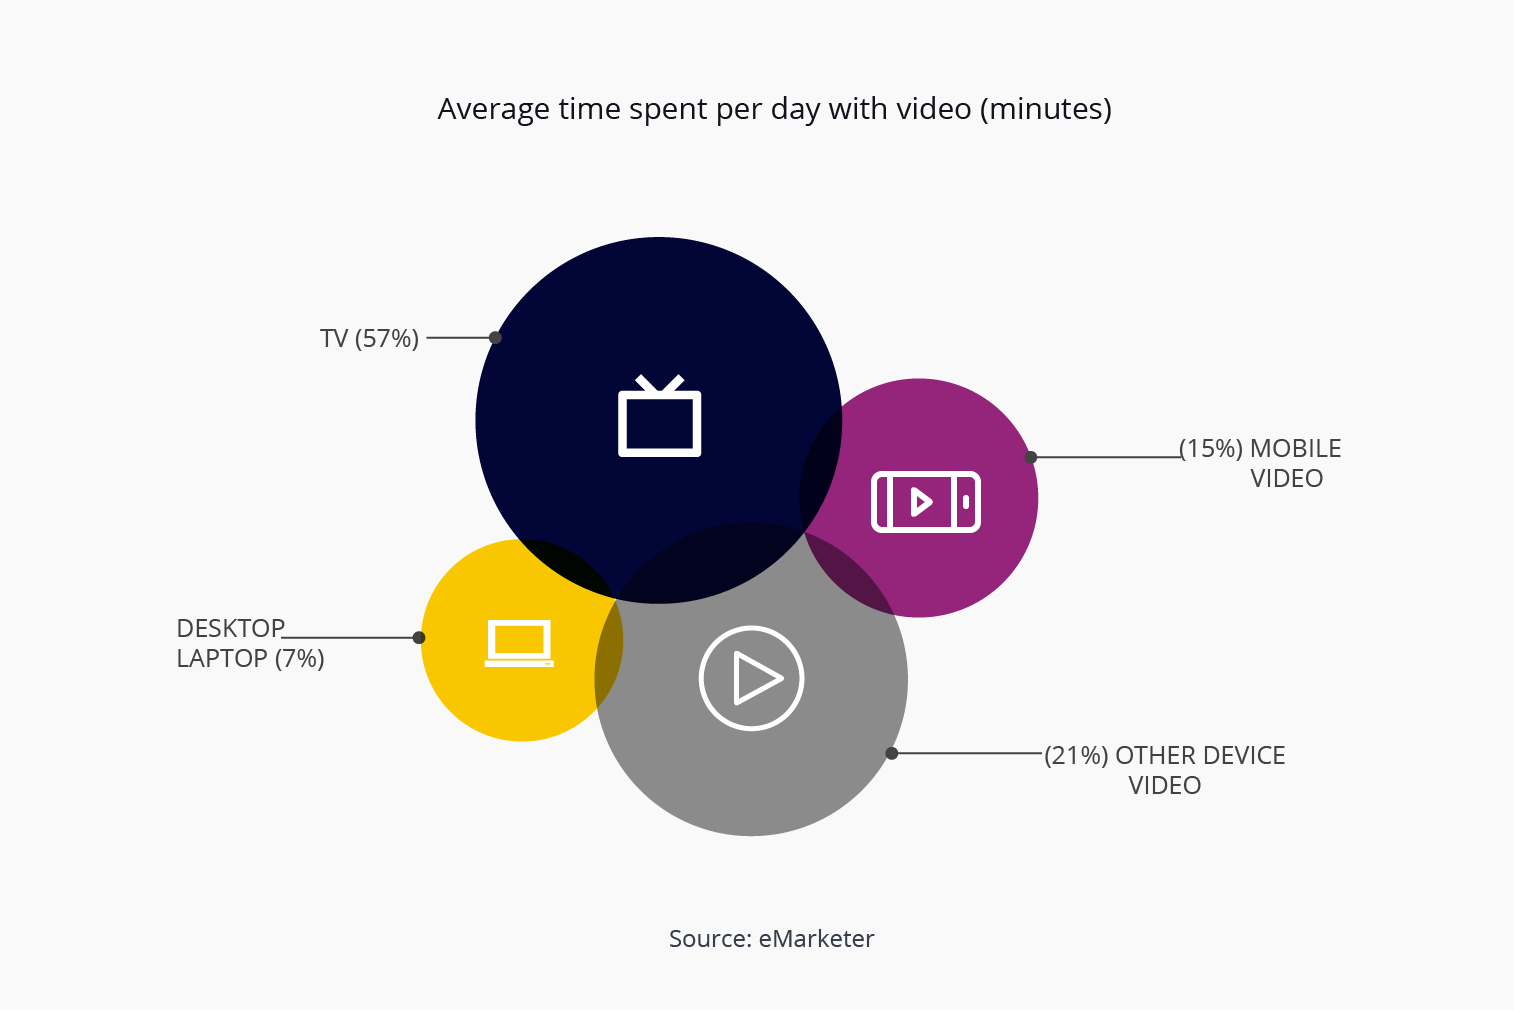
57% of the time people spend watching movies through their TV.
In 2021, TV still holds the highest share of time spent watching video at 57%, but this is down 3% points from 2020. Other connected devices, like laptops and smartphones, make up for the 21 percent of the time spent watching video – which is an increase from 18% in 2020.
Other connected devices includes game consoles, smart TVs, and devices such as Chromecast and Roku.
Home and mobile entertainment market in the U.S.
In 2021, the gender composition of home/mobile viewers of all frequencies was generally similar to the population. Although physical disc adult viewers skewed slightly more toward men, the percentage difference was not large.

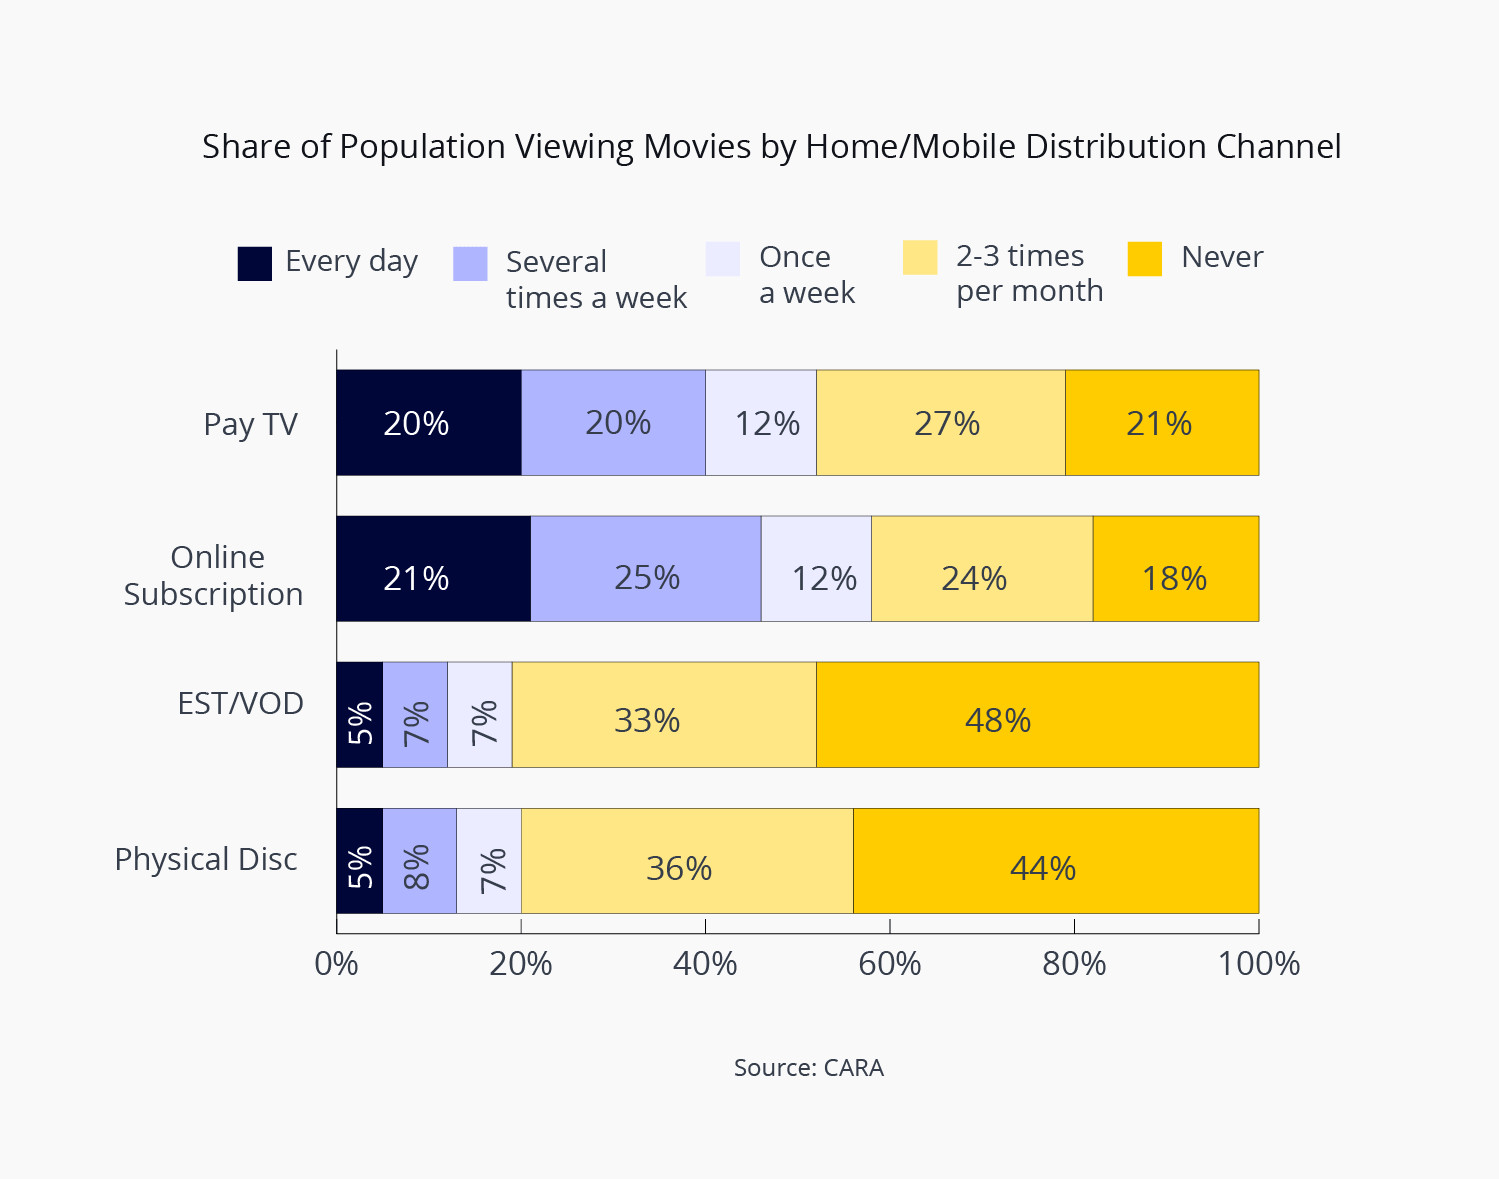
Over 20% of people watch movies through Pay TV and online subscriptions
In 2021, 52% of U.S. adults watched movies via online Electronic Sell-Through (EST)/video-on-demand (VOD) services, down from 54% in 2020. Of those who viewed movies via EST/VOD in 2021, 60% also paid to rent movies not released or newly released in movie theaters (PVOD).
Pay TV includes regular television channels, premium channels and pay-per-view services.
